Trace model requests
Send spans around LLM calls and inspect their duration, status and attributes. Include provider and model names in your instrumentation to keep that context with the request.
Trace model requests, retrieval and tool calls with OpenTelemetry. See where your AI application spends its time, inspect failures, and connect the request to its logs in Site Qwality.
A slow answer might start with a model call, a database query or a tool request. Instrument those steps as spans and inspect them together, alongside the services your application already depends on.
Send spans around LLM calls and inspect their duration, status and attributes. Include provider and model names in your instrumentation to keep that context with the request.
Keep retrieval, model calls and tool execution in the same trace by propagating trace context. The waterfall shows the steps your instrumentation captures.
Search traces by service, duration and status. Filter on the span attributes you send to narrow an investigation to a provider, model or operation.
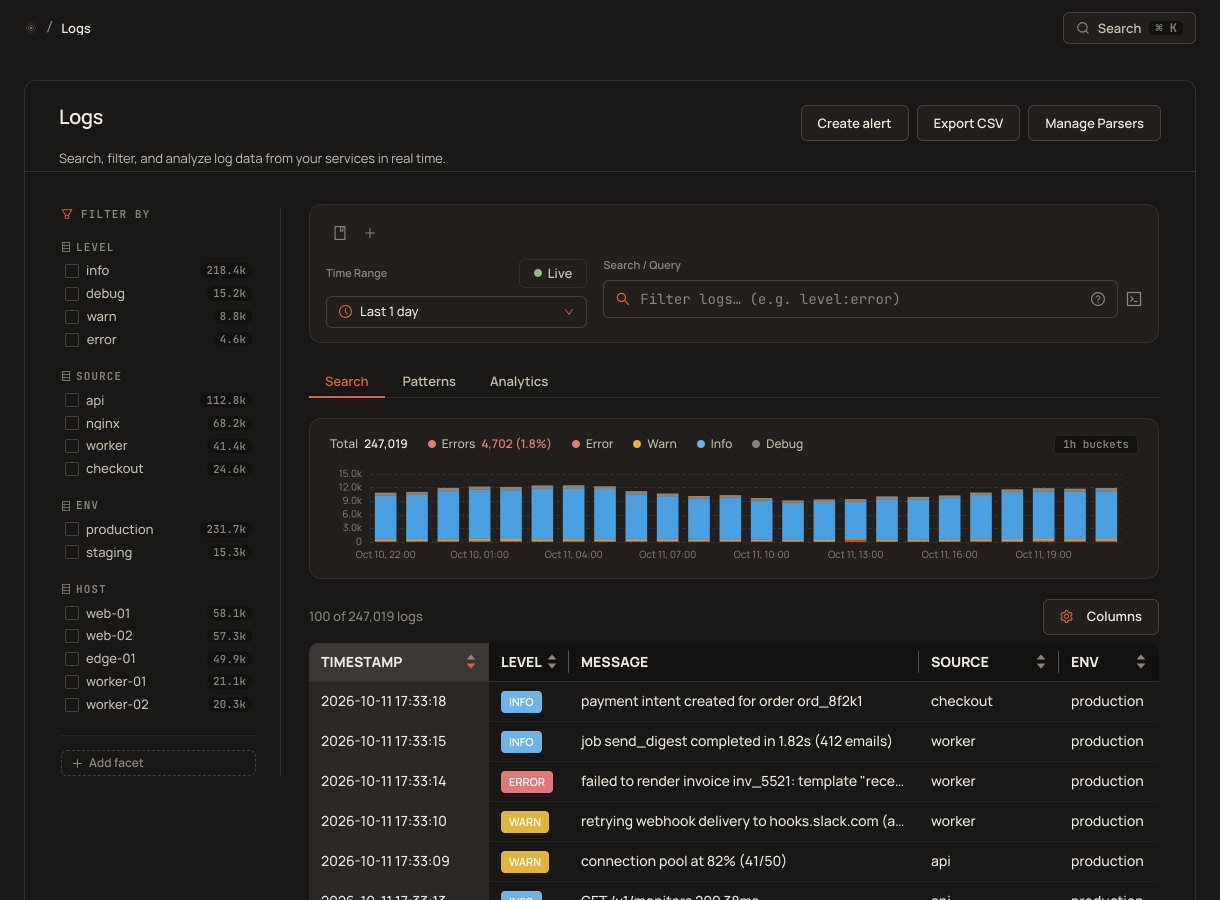
Send application logs with the same trace ID and open them from the trace. Put a failed model request next to the application events that explain it.
Use HTTP monitors to check your application endpoints on a schedule. Configure requests and expected responses, then route availability alerts to your team.
Connect Claude, ChatGPT, Cursor or another remote MCP client to Site Qwality. Grant access to traces, logs and incidents so your assistant can help investigate. Explore the MCP server.
Hosted models, a self-hosted model or a mix of both: send the spans your application emits through OTLP over HTTP. Your instrumentation determines which calls and attributes appear. Site Qwality does not need access to your model provider account.
Open the request trace, find the span that took the time, and inspect its attributes and status. Read matching application logs to see what happened around the call. The same workflow works for an AI feature and the rest of your application.
You can trace calls to these providers when your application or compatible instrumentation emits OpenTelemetry spans for them. Site Qwality receives those spans over OTLP/HTTP. It does not automatically instrument a provider SDK when you sign up. Use the trace exporter guide to connect an instrumented application.
Yes, through the spans you send. Instrument retrieval, model calls and tool execution, and propagate trace context between steps to see them as one request. Steps without instrumentation will not appear in the trace.
This page covers request tracing, application logs, API availability and MCP access. It does not include automatic token-cost calculations, prompt management, answer evaluations or hallucination detection.
No. You choose which attributes your instrumentation exports. Duration, status, provider and model metadata can help investigate performance without sending prompt or response text. Review your instrumentation settings before sending application data.
AI monitoring helps you inspect the performance and failures of your own AI application. The MCP server lets an AI assistant read or manage Site Qwality data within the permissions you grant. You can use either one independently.
Yes. Logs, metrics and traces share the free telemetry allowance. MCP access is also included on the free plan. See pricing for current allowances and retention. Your model provider and AI assistant subscriptions are separate.
Uptime, cron, synthetic, log, RUM, incidenti e pagine di stato. Piano gratuito su ogni prodotto.